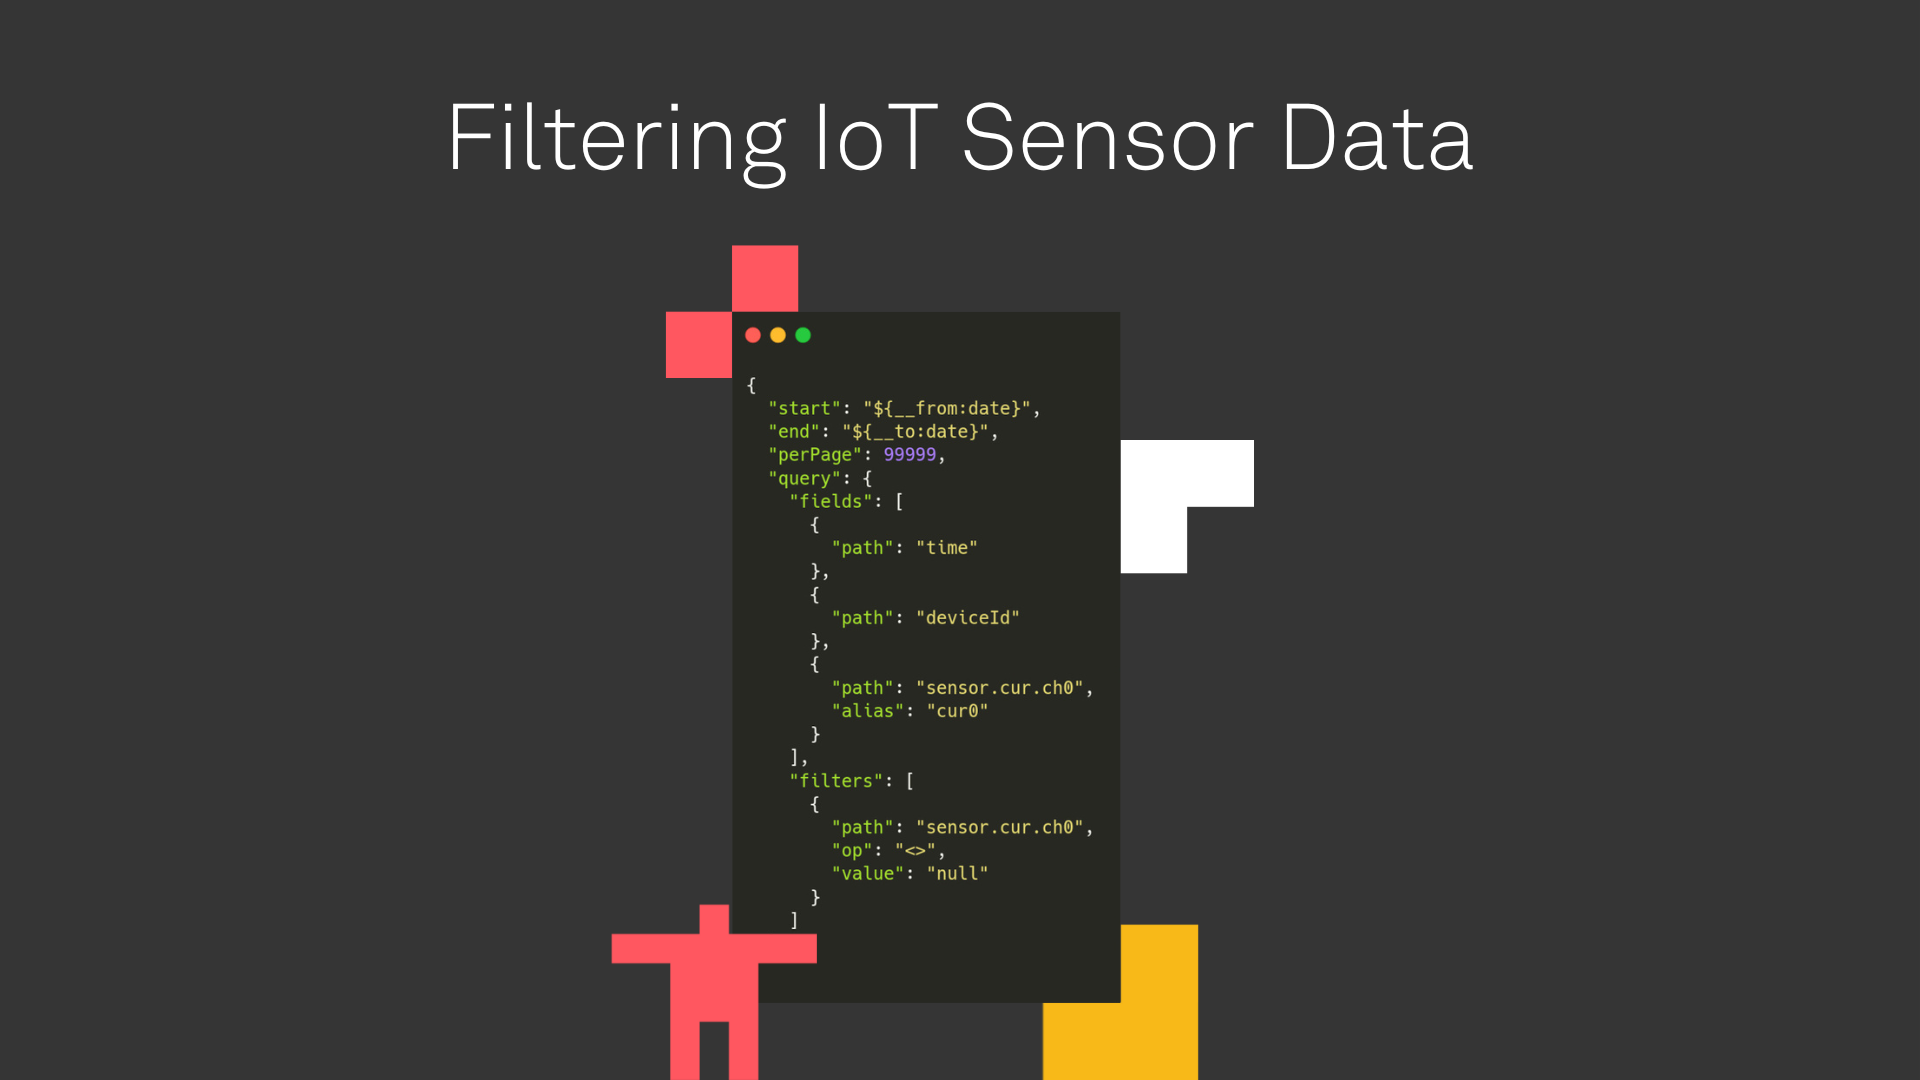
Filtering IoT Sensor Data with Golioth Rest API Queries in Grafana
Golioth collects data from your entire IoT sensor fleet and makes it easy to access from the cloud. Data visualization is a common use case and we love using …

Golioth collects data from your entire IoT sensor fleet and makes it easy to access from the cloud. Data visualization is a common use case and we love using …

JSONata is language to parse information coming back from the Golioth REST API. This article showcases how to use the language to pull data out of complex query …
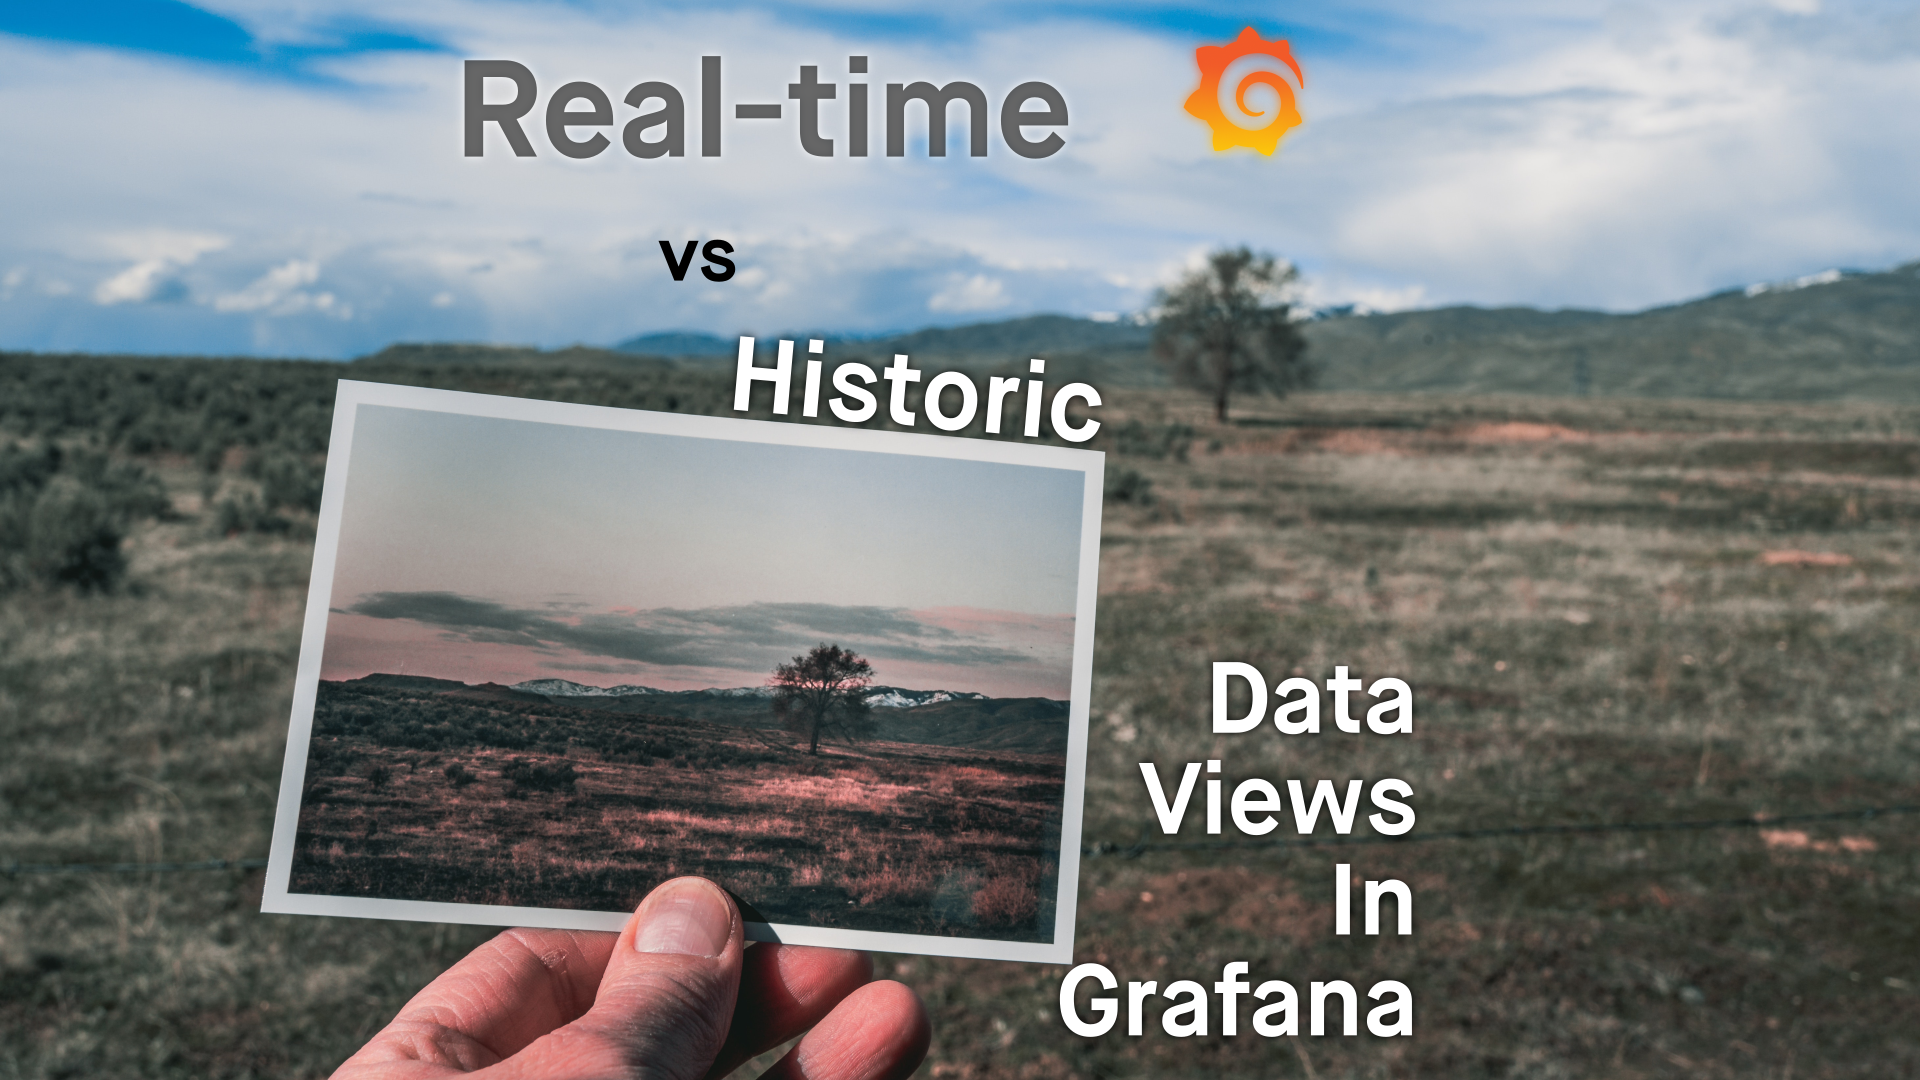
We often use Grafana for visualizing data from IoT devices. We even wrote a WebSockets plugin for the platform that makes sure you can graph your live data as …
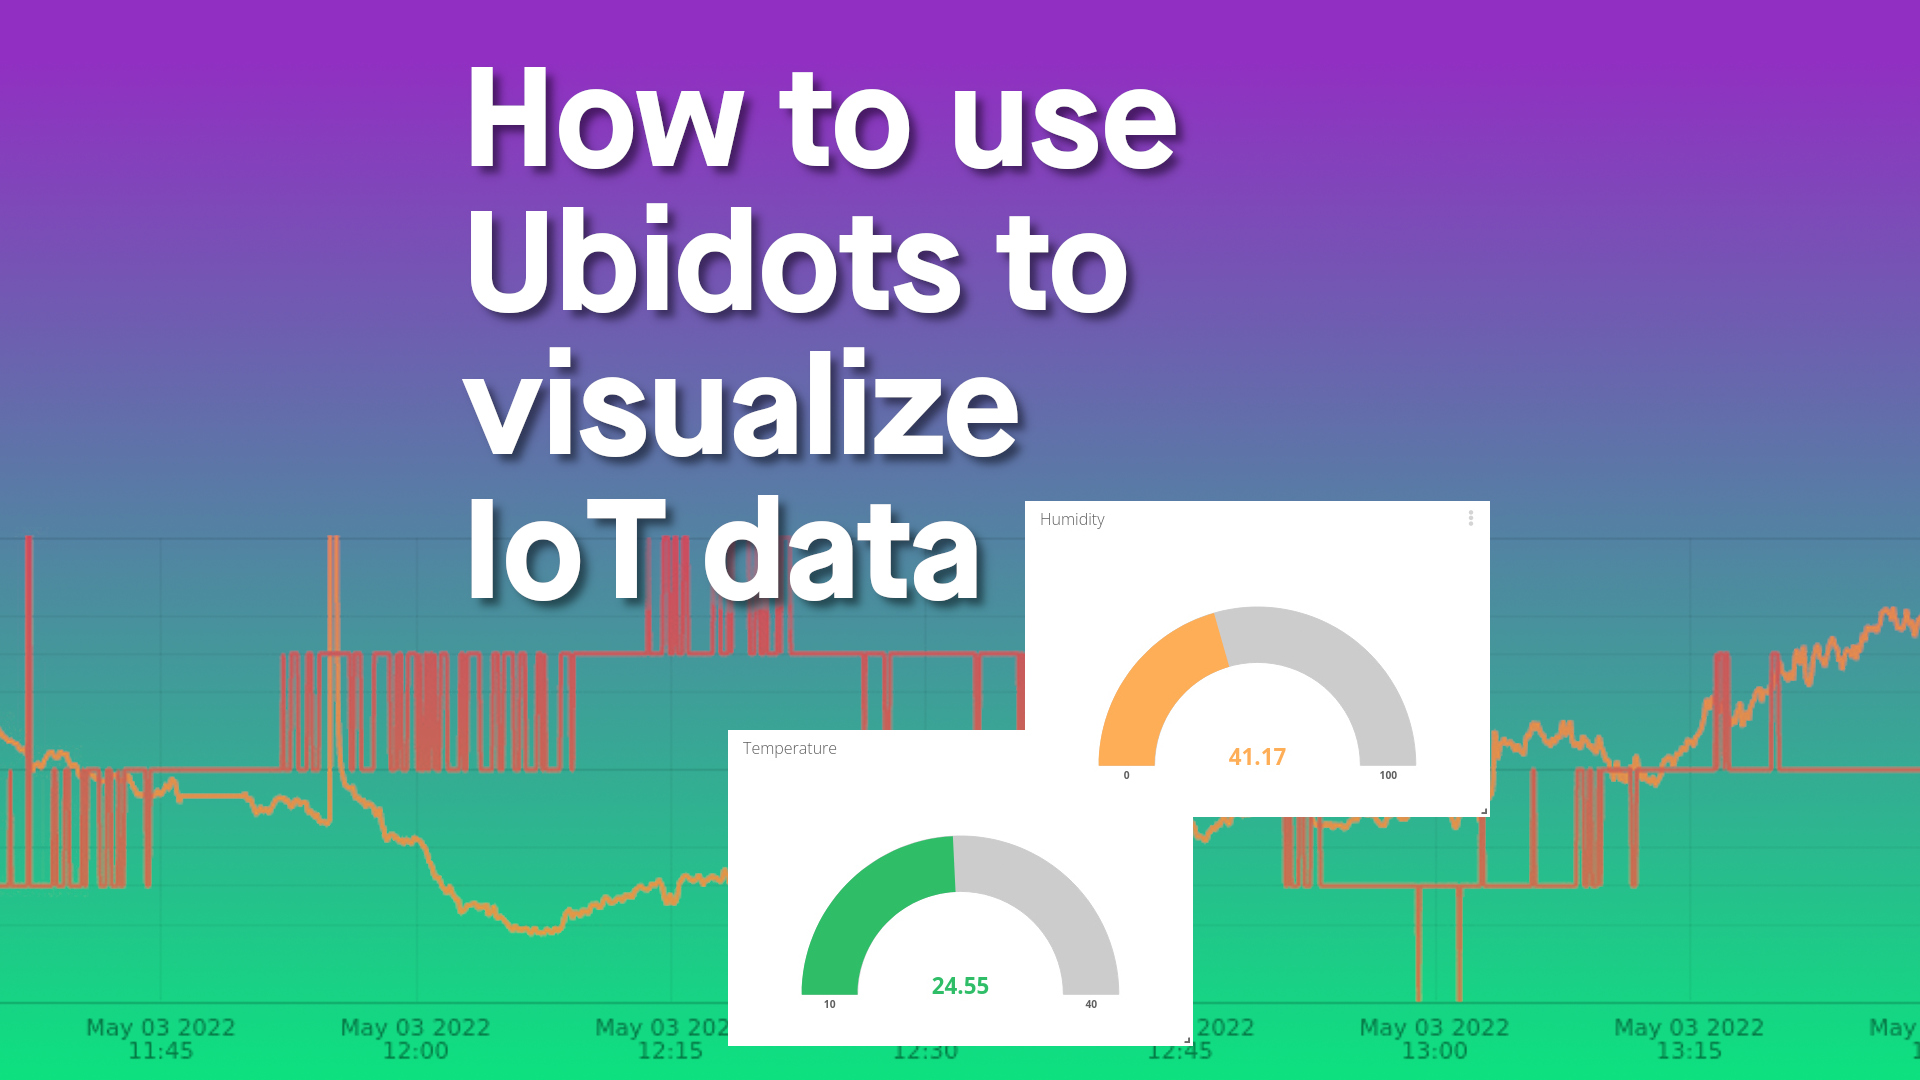
Golioth is excited to announce our newest output streams integration with Ubidots. Thanks to this partnership, Ubidots data visualization dashboards are now …
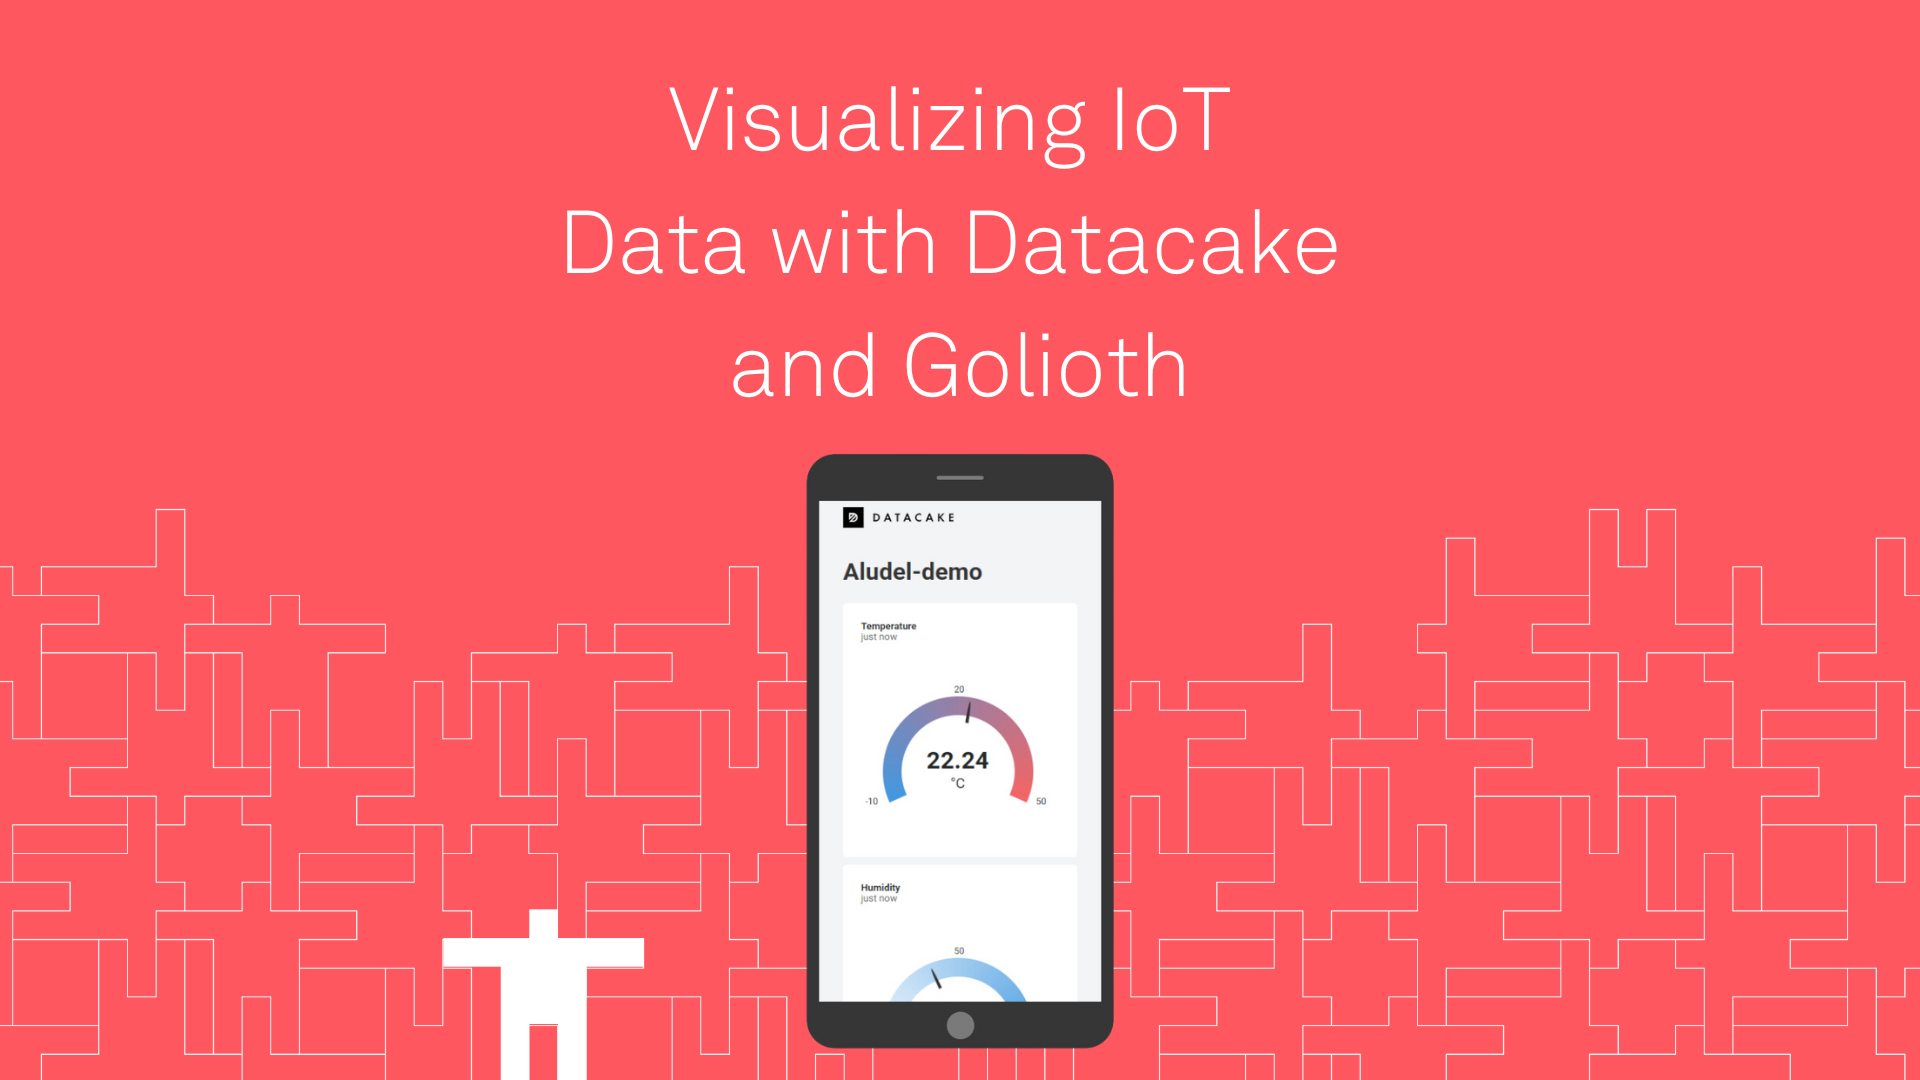
Golioth has partnered with Datacake to make it easy to stream data from Golioth devices to beautiful visualization panels on the web. Showcase your IoT data …
The Golioth WebSocket plugin is now available in the Grafana Cloud. This post guides you through how to add the plugin to Grafana, how to connect the Golioth …