'Metrics at a glance: adding dynamic graphics to your Grafana Dashboard'
Graphics make it easier to understand what's happening on IoT dashboards. Try out this Grafana plugin to enhance your deployment and better understand what is happening in the physical world.
We use Grafana at Golioth to help us showcase data for internal and external demos. As in any IoT deployment, the hardware does not exist just in the physical realm; it also sends data back to the internet and we need some way to show that data. Grafana is an open source solution that can run locally on your computer, on your own cloud, or on the Grafana Cloud. We have written about our past use of Grafana, including our custom WebSockets plugin that makes it easier to see changes to your data as it happens. When you’re ready to highlight changes from a device, graphics can make it easier to understand what’s happening. Let’s take a look at how to add dynamic graphics to your Grafana Dashboard.
Why you should use graphics
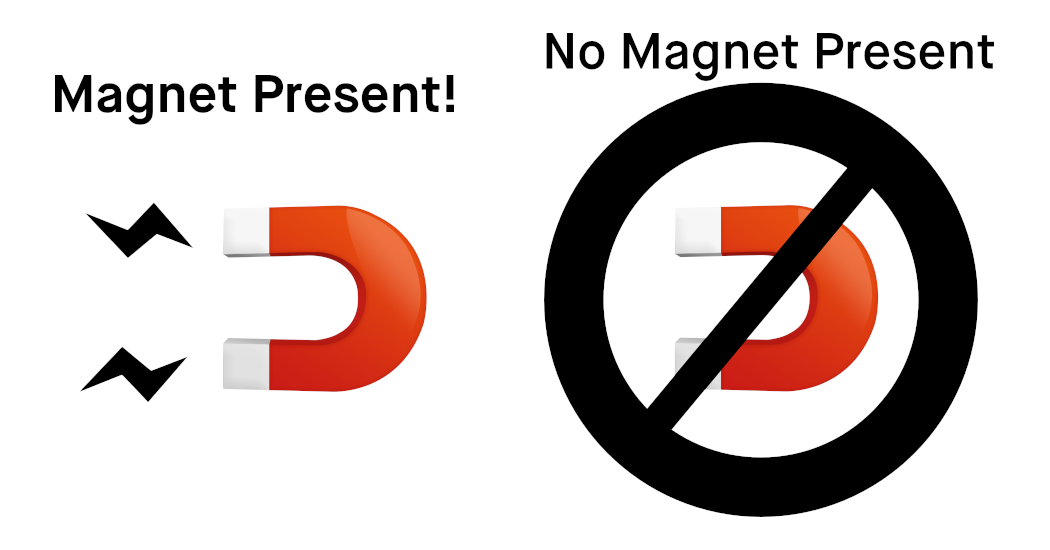
These graphics convey immediate understanding for magnet sensor stateHumans are a visual species. Our eyes naturally track movement in nature, but that also translates to computer screens. Adding some dynamic graphics will not only grab attention, but allow users to quickly assess if there are problems. A quick scan over a graphical interface allows you to take fast action on critical changes to your deployment. In the “Red Demo” video below, you can see the device detecting a change in proximity sensor state, which could indicate something like a break-in at a home or business. A dedicated graphic on the dashboard clearly indicates this change to the user. Another reason to look at simplified graphics is the changing nature of your IoT Fleet Deployment. As you continue to add people to a project, the knowledge around the technical details often diffuses; the people that designed and deployed the firmware and hardware aren’t always the ones maintaining the deployment. You want to design a dashboard that anyone can walk up to and understand the current state of the device, regardless of their technical background. Most importantly, you want to indicate whether any action needs to be taken. This could include adding callouts to your graphics or other indicators that the device is nominal or in an error state. It’s much beyond this article, but there are books on proper design of Human Machine Interfaces and case studies of how they have gone wrong. Finally, let’s compare graphics to the common alternative in dashboards: graphs. While it’s useful to see data changing over time, a new user won’t have context for the changes. If they walk up to a dashboard and glance at a moving chart of temperature, there’s no way to understand why it’s being shown and required actions (“the chart just went up, was that good or bad?”). Even if you start with stateful based indicators like dials and readouts, these can be enhanced by adding contextual information directly to the graphics.
How to add dynamic graphics
First, you will need a Grafana instance, configured to access the datasource of your Golioth deployment. We have found it makes the most sense to highlight
the current state of the device by using a WebSockets source, instead of polling the REST API on a regular interval. Using WebSockets will ensure you are immediately notified of the changes as they propagate through your device deployment.
Plugin
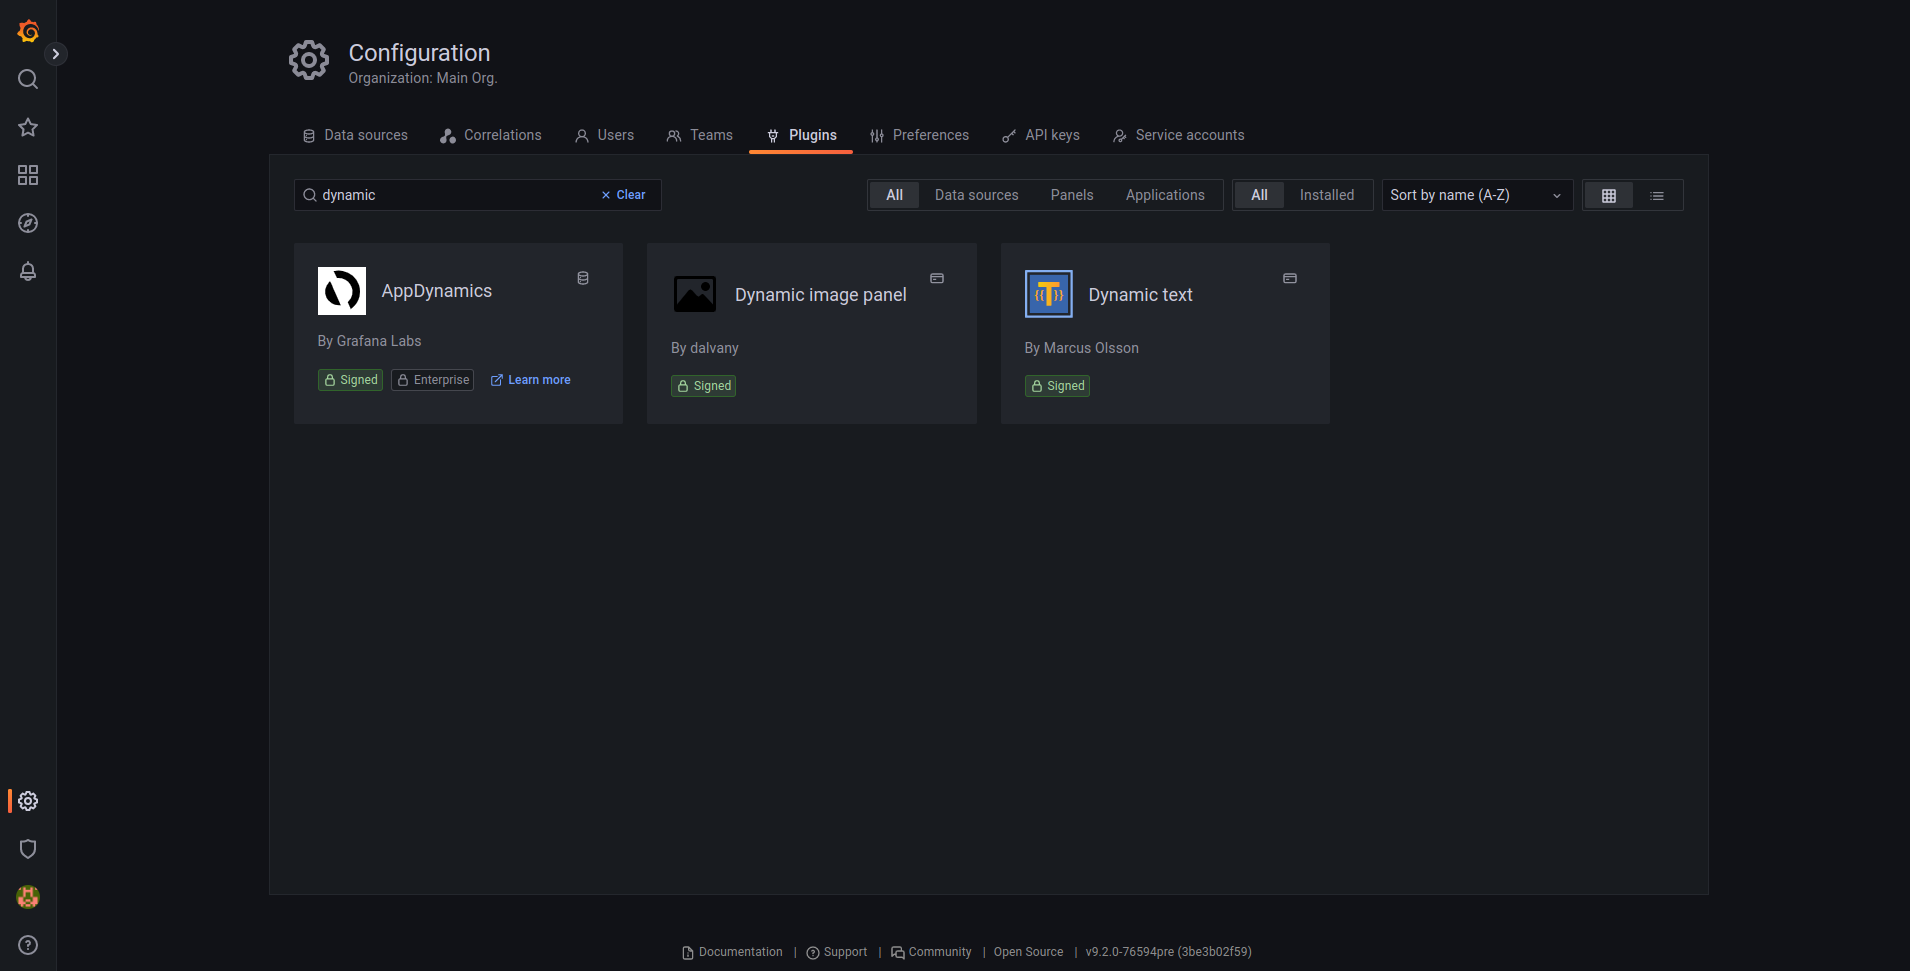
To start, you need to install
the “Dynamic Image Panel” Plugin from the Grafana plugin marketplace. This is a signed plugin, and should be safe for all installs. In the example, they showcase a weather application, talking to an API that fetches different weather condition graphics. We will be creating a slightly different implementation, based on hosted images on a cloud server without an API. This is not as robust generally, but is much simpler as an implementation.Installing the plugin from the Grafana marketplace (available locally or on the cloud)
Hosted Graphics
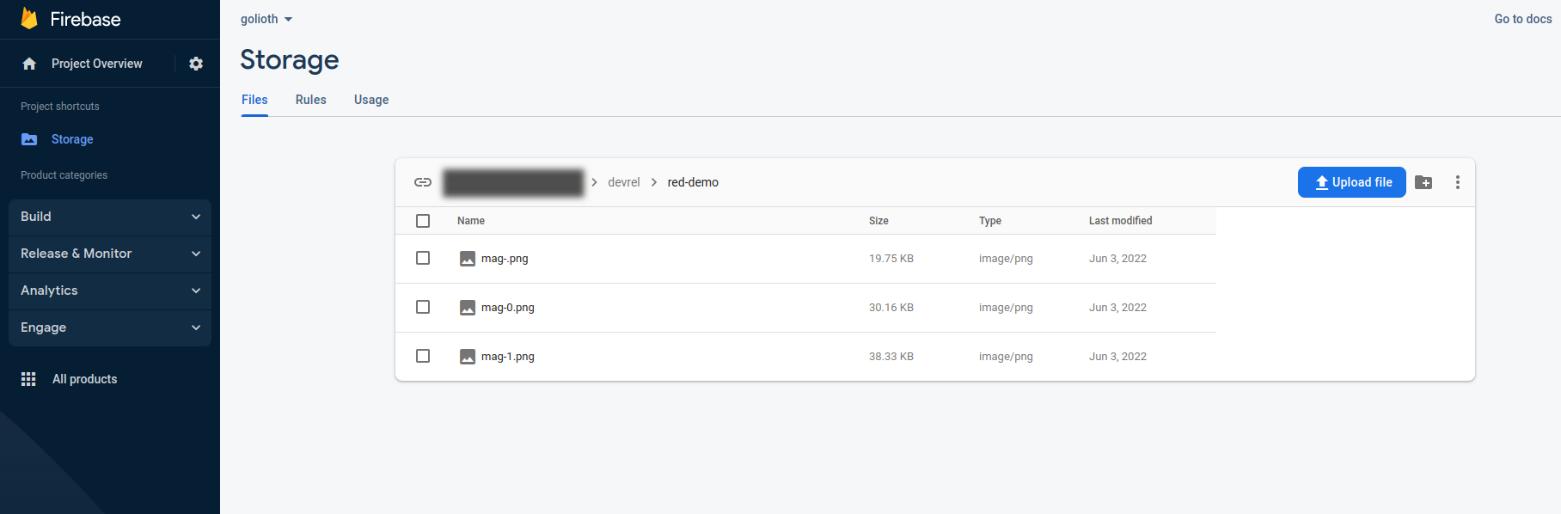
Next you need to put the associated graphics somewhere that the Grafana instance will be able to access them. In our case, we used Firebase hosting to create a static file location. This can be any service that allows public access to the images, but we do caution you to test that you can access the images when you’re not logged in, or your dashboard may not be able to pull in those images you created.
Assigning graphics to device states
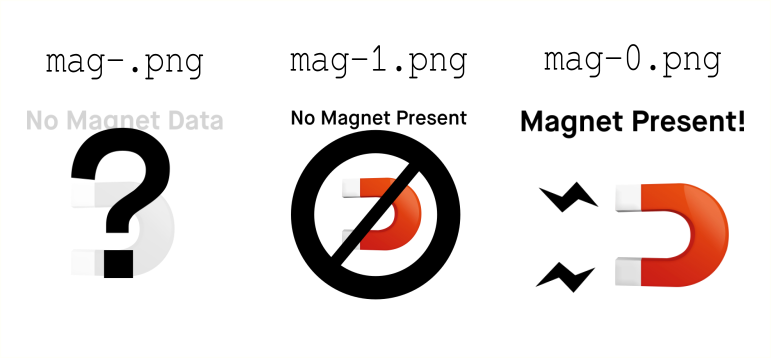
We created the “Red Demo” graphics to correspond to proximity sensors based on sensing a magnetic field. The device is reporting the state of that mag sensor over LightDB Stream, along with temperature and accelerometer data on a regular basis (or on-demand when the button is pushed, as shown in the demo video inset above). The logic is reverse for this sensor (‘0’ means there is a magnet present, ‘1’ means it is not), which we maintained throughout the system. We then created graphics that append that reading to a “base” address to access each individual image. When there is no reading available, it defaults to the NULL case, which means nothing is appended to the “base” address, and we show that it is in an unknown state (far left image).
On the plugin, you can customize all of this and make it match your needs. Instead of ‘1’ and ‘0’, a device might be sending linear values from 0-10, or it might be sending “true” or “false” (boolean), or even sending back general strings. The main thing to consider when designing your graphics is that you want your device and the Golioth Cloud to categorize physical readings into “buckets” that are easy to display.
Creating “movement” in graphics
Sometimes you’ll want to make changes in state a bit more subtle, especially if your device is reporting more than a binary state (‘on’/’off’).
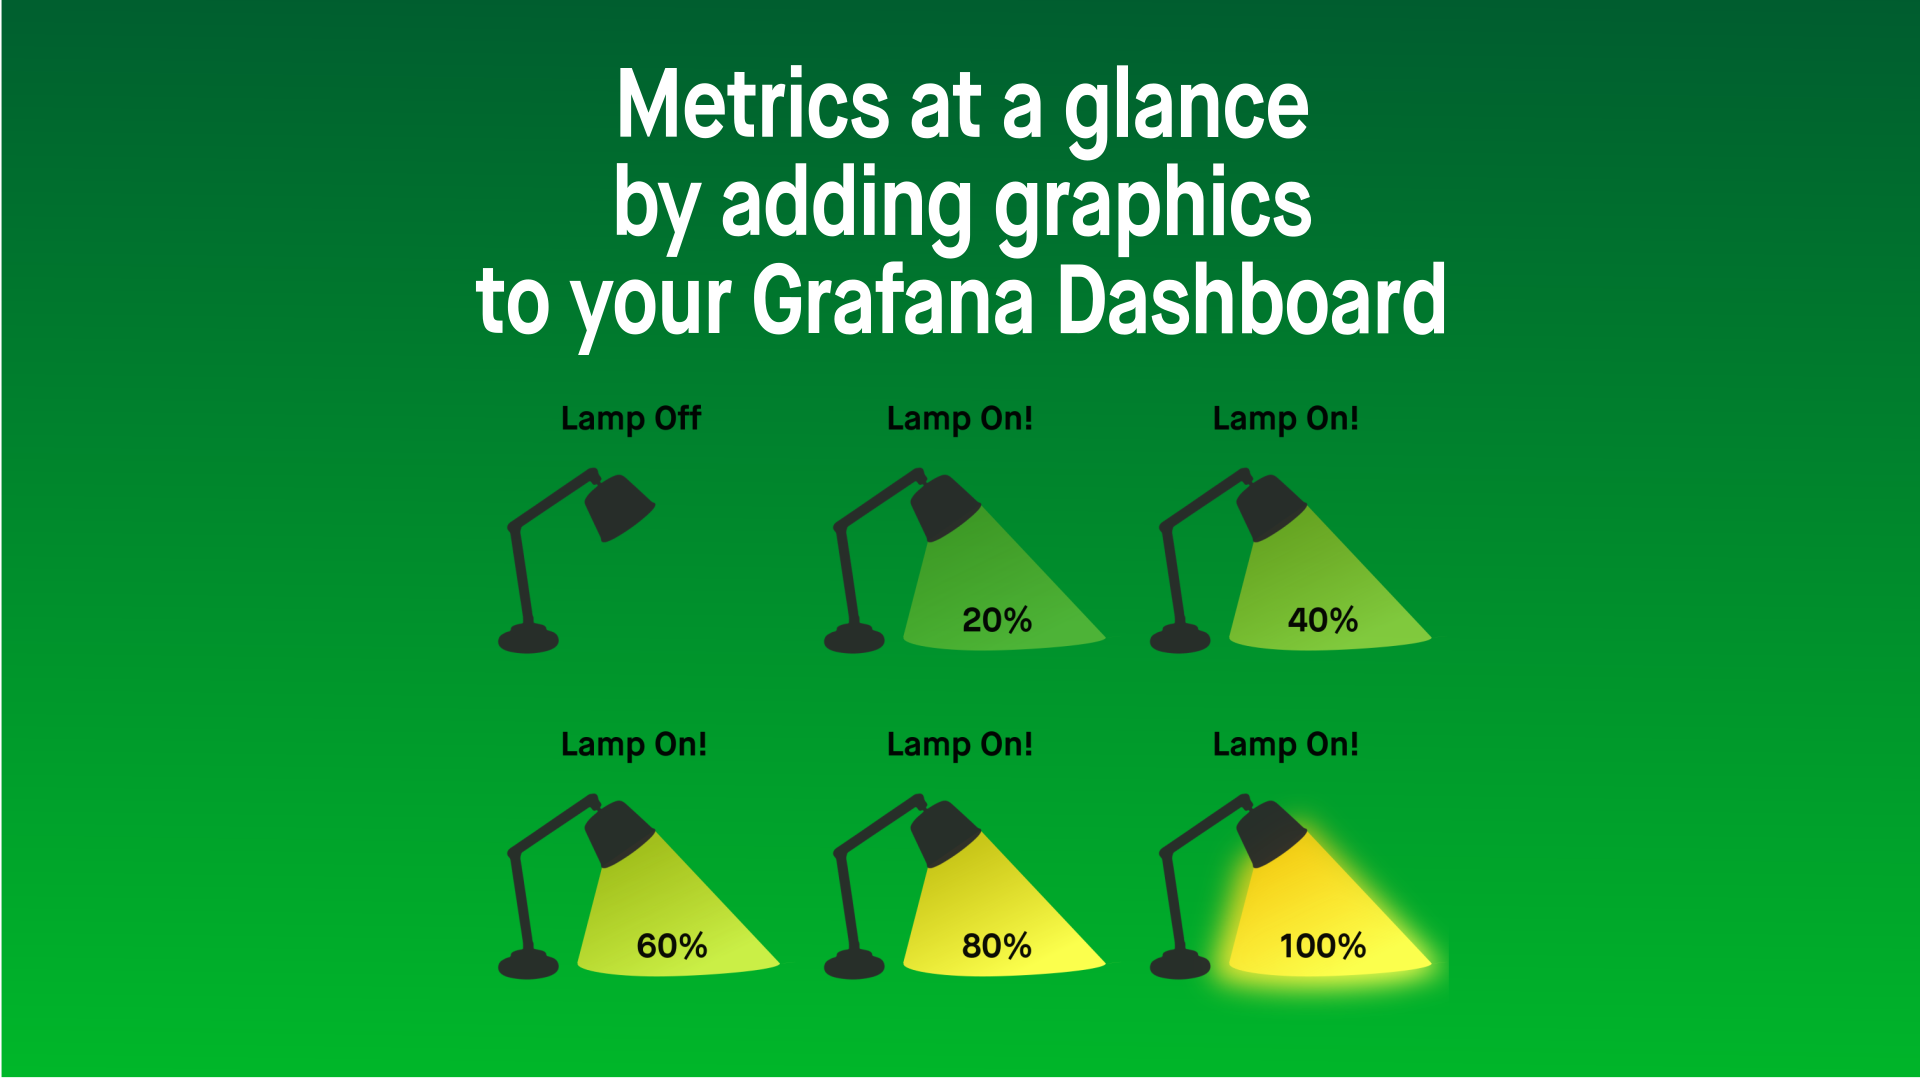
In Golioth’s recently released “Green Demo”, you’ll see there are 6 states for a lamp used in our Greenhouse example. The graphics change along with the intensity of the light coming out of the lamp, while also overlaying a numeric value.
Enhance your next dashboard
Using graphics in your next IoT dashboard can help you add interesting informational content, alert your users, or just spice up what is normally a set of boring charts. If you want help getting your next dashboard started, reach out on
our forum, our discord, or send us a note.
Chris is in Developer Success at Canonical, working on content and new prototypes related to Golioth. He is a 20 year hardware engineer and has built a range of custom IoT hardware designs as part of his work for Golioth.
Golioth has built a range of custom hardware to test out many of the aspects of our own IoT offering. These challenges mirror what our customers face with their …
Wi-Fi HaLoW enables high throughput, at a long distance using ISM band radios (850-950 MHz, depending on location). This post introduces the concepts behind the …
 On the plugin, you can customize all of this and make it match your needs. Instead of ‘1’ and ‘0’, a device might be sending linear values from 0-10, or it might be sending “true” or “false” (boolean), or even sending back general strings. The main thing to consider when designing your graphics is that you want your device and the Golioth Cloud to categorize physical readings into “buckets” that are easy to display.