'AC Power Monitor: A Golioth Reference Design'
This IoT Power monitor is the newest reference design from Golioth. Quickly deploy a fleet of devices for monitoring electrical equipment to increase efficiency and monitor machine outages.
Power monitoring is a common Internet of Things (IoT) application. Whether it’s to track the health of manufacturing tools (“Do I have a motor bearing about to give out?”) or to provide consumer insight (“Can I save money by running the clothes dryer during off-peak hours?”), gaining granular feedback on your electricity usage is a valuable tool. This concept inspired Golioth’s latest reference design: an AC power monitor that records reading to the Internet.
The AC Power Monitor
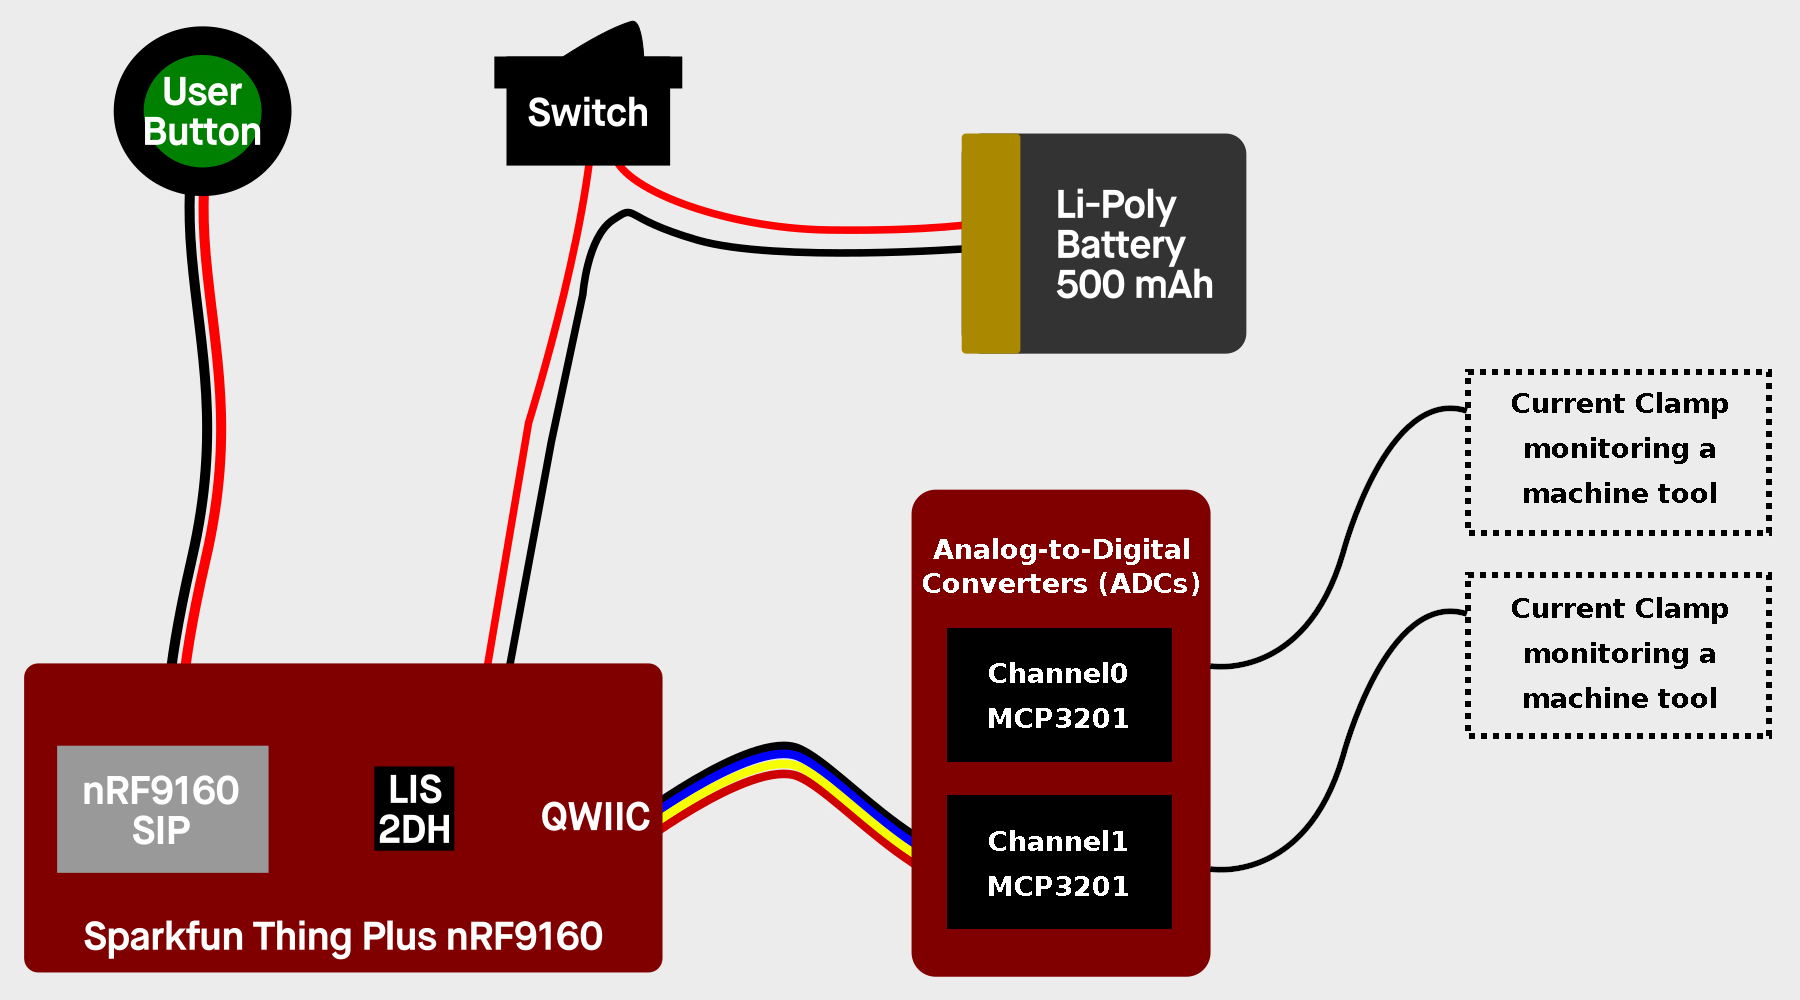
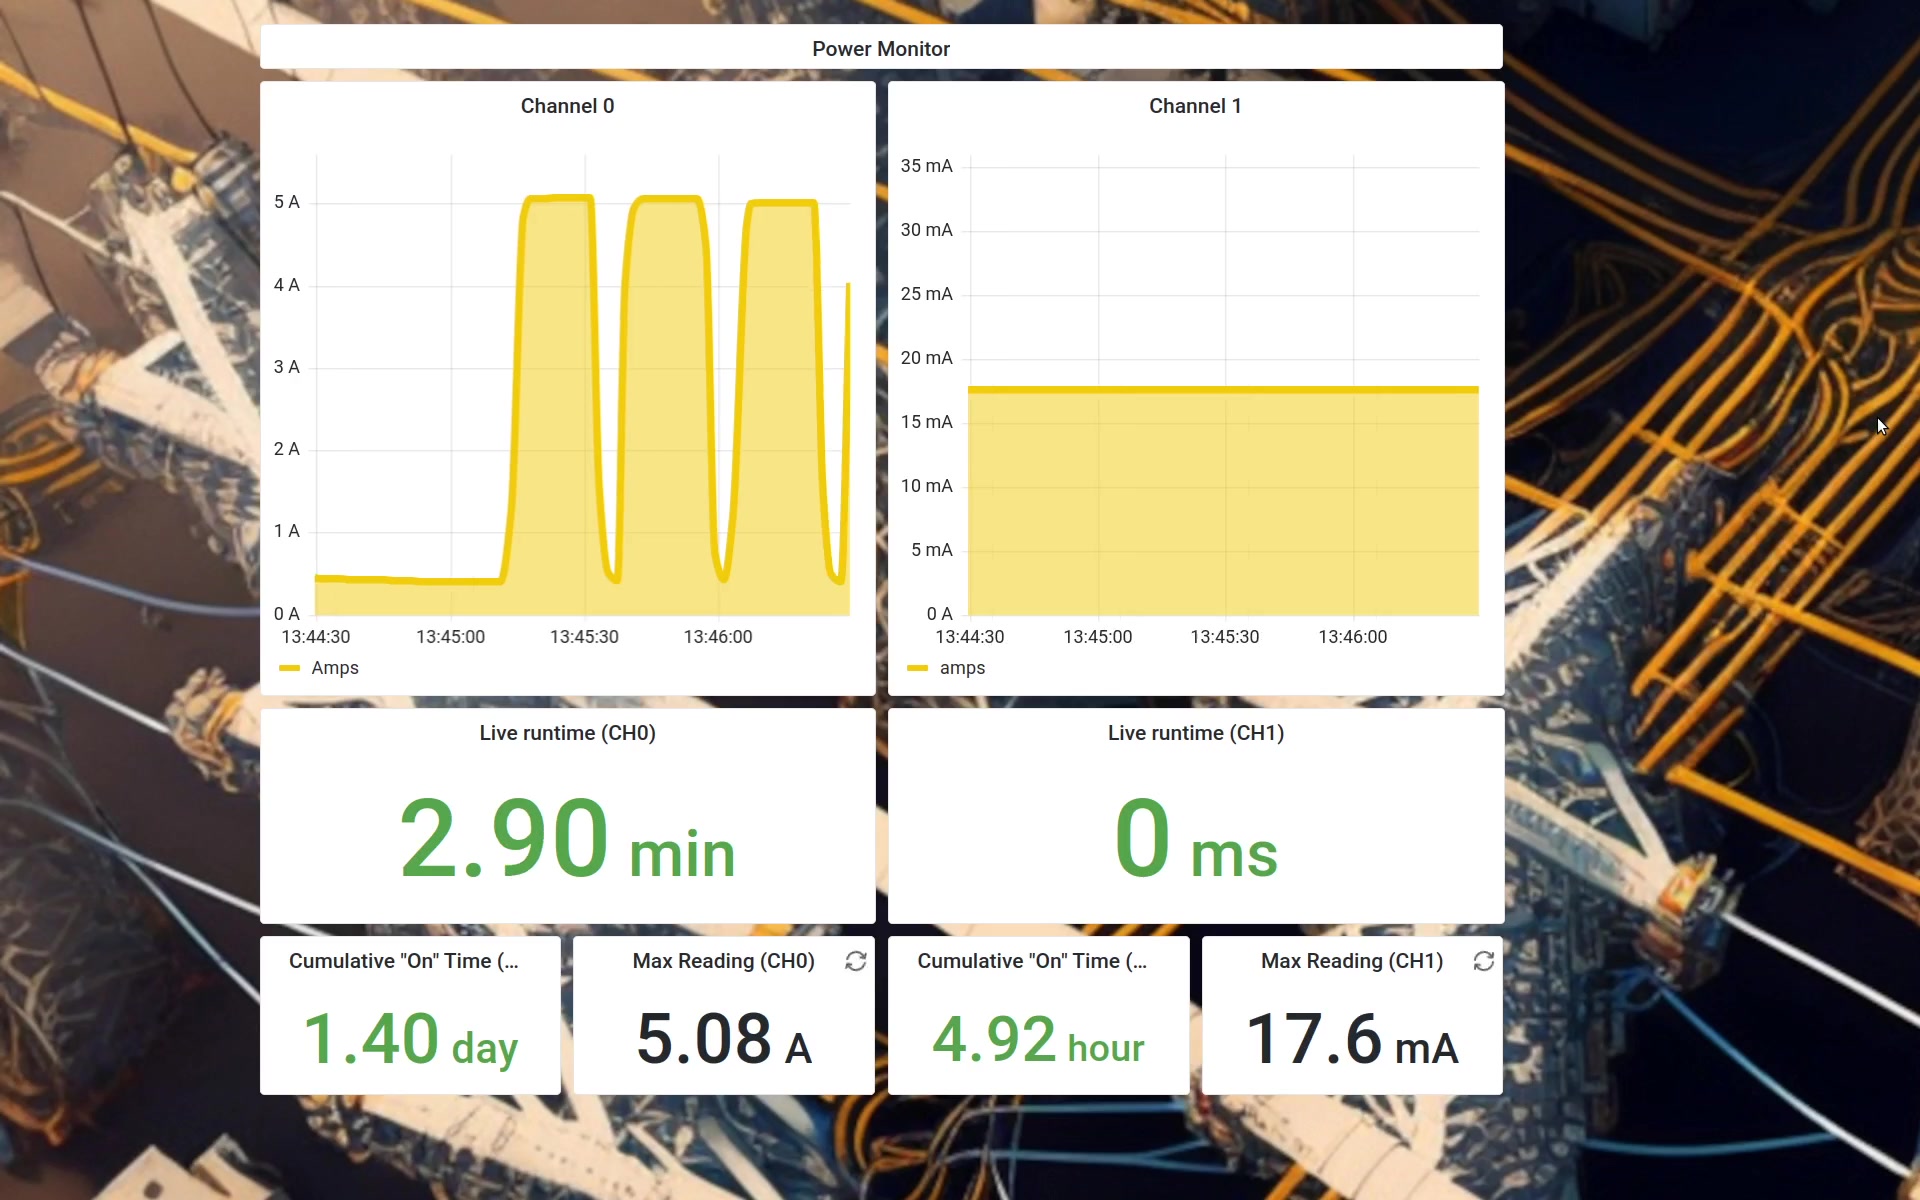
With Golioth, it’s quite easy to add IoT power monitoring to any electrical device. We utilize non-contact current clamps that can be added to a machine tool’s power supply, or at the breaker in an electrical box. The current sensor clamps around a wire, detecting the magnetic field generated when current is flowing to the device being monitored. The readings are uploaded to Golioth where they can be visualized and acted upon. In this application, two channels stream readings back to Golioth where they are stored along with their timestamp. The power monitor tracks “run” time—how long the device being monitored has been running without a break. The system also records the cumulative “run” time so that you can track the service life of your equipment. This data is invaluable in planning maintenance and identifying the most used equipment to inform future investment in your production abilities.
Hardware
Starting from a reference design helps get your proof-of-concept up and running. With that in mind, we like to use off-the-shelf hardware as much as possible.
Firmware
The firmware for the Power Monitor reference design uses
the Golioth Settings Service. This service can update a single device’s settings, and also provides fleet-wide control via our web console (and our REST API if you need it).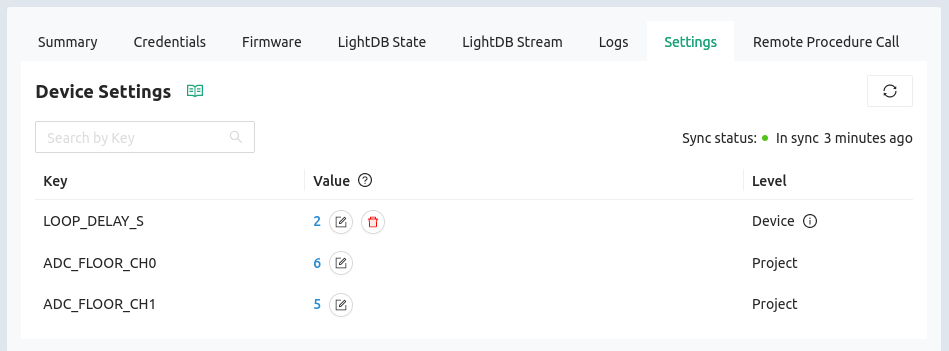
Cloud Software / Dashboard
The Golioth Zephyr SDK takes care of the cloud connection for all of your devices. When writing firmware, just use the API to set/get/observe your data and Golioth handles the rest:
- Sensor readings are stored as time-series data on LightDB Stream
- Device settings are monitored in real-time, with the device reacting to your changes as soon as you make them.
- The Golioth Console tracks the latest device state, including device health
- Current firmware version is monitored, with the ability to rollout new OTA updates, and one-click rollback if you need it
- Golioth’s convenient REST API delivers easy access to the data for visualization or export to any of your favorite cloud server platforms. We’ve set up a dashboard on Grafana, one of our favorite visualization tools. It queries the Golioth REST API for device data and presents it as a handsome web interface.
More Golioth Reference Designs
Our reference designs are like a business in a box. Using Golioth as your device management cloud, your first prototype will be running within hours, not weeks. These designs are built to scale, with the same infrastructure in place on day one that you need on the day you deploy your 1000th device. We’re always working on more reference material for you to take and customize for your business needs. Check out the Industries section of the Golioth website, which discusses areas we are targeting and Reference Designs we are building. If any of them interest you, click the “Schedule Demo” button for the one that best matches your needs. You can also drop a note on our Forum or on our Discord if you have ideas of other IoT prototypes you need help with or would like to see us build.