How to Connect Live Golioth IoT Data to Grafana Cloud using WebSockets
The Golioth WebSocket plugin is now available in the Grafana Cloud. This post guides you through how to add the plugin to Grafana, how to connect the Golioth WebSocket API, and how to set up a dashboard to visualize realtime the data.
Live data visualization shows you what is going on with your IoT fleet right now, and it makes for impressive customer demos. We previously wrote about [how to visualize live data on the self-hosted version of Grafana][1] using the WebSocket plugin we wrote. Today let’s walk through how to connect live Golioth IoT data to [Grafana Cloud][2].
Overview
[Golioth][3] is the translation layer between your fleet of IoT devices and the cloud. Among our many ways of accessing the collected data, [WebSockets][4] are one way to get live updates as soon as the data arrives.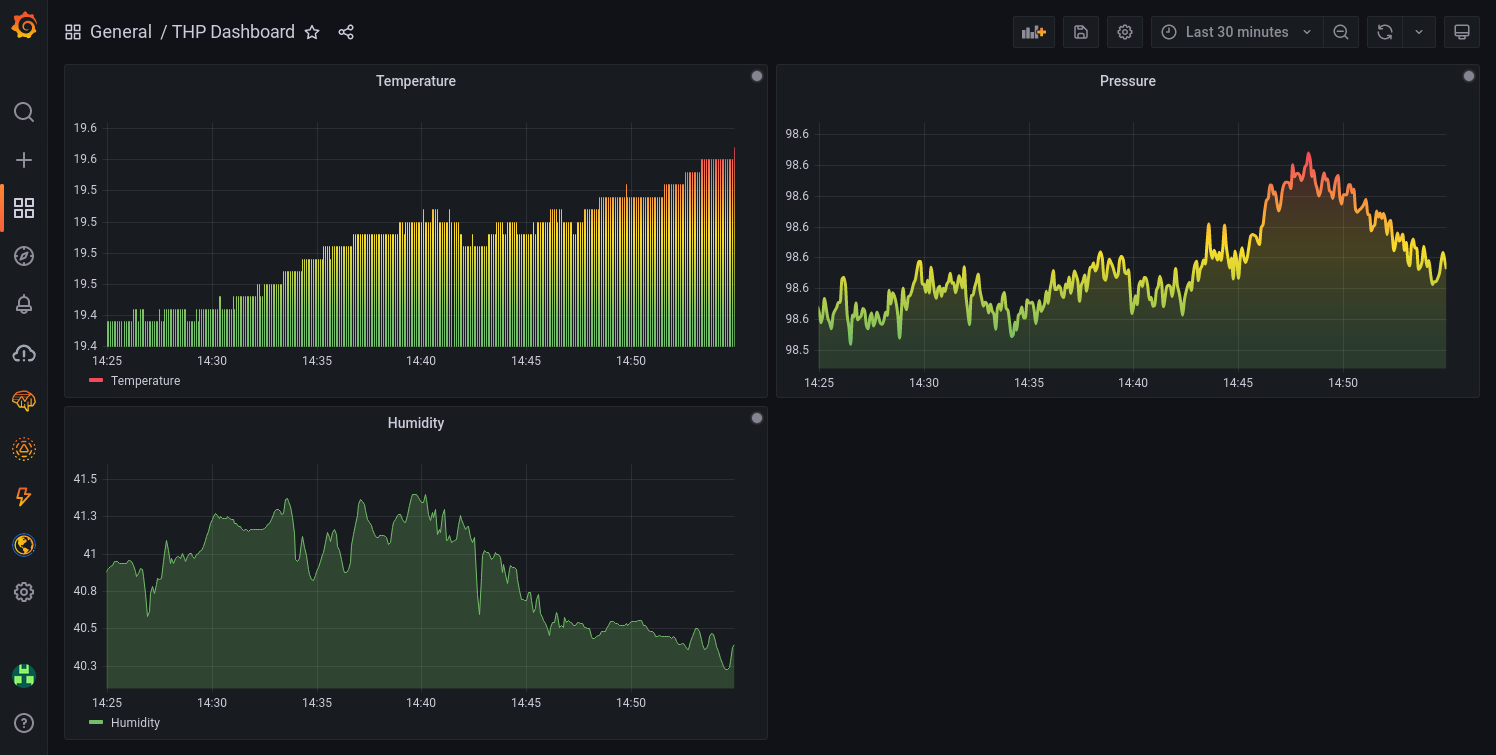 We wrote a WebSockets plugin for Grafana, the monitoring and observability software. The plugin is open source ([here’s the code repository][5]) and as of just a few days ago it’s available in Grafana Cloud, the cloud-hosted version of the software. Today I’ll guide you through:
- [Sending some temperature sensor data to Golioth][6]
- [Configuring the Golioth WebSocket API on the Grafana Cloud][7]
- [Graphing the temperature data in realtime][8] This example has everything you need to adapt it for your own needs.
1. Send Sensor Data to Golioth
{#golioth-sensor-setup}
[the LightDB Stream example][9] that is part of the Golioth SDK, and running it on an ESP32. This example is a good one, since it will either use a temperature sensor you have configured in the devicetree, or simulate a temperature sensor if there is not one available. First, find your device credentials in [the Golioth Console][10] by selecting Devices from the left sidebar menu and clicking the name of your device on the resulting list. [sourcecode lang=”yaml” firstline=”26″] CONFIG_GOLIOTH_SYSTEM_CLIENT_PSK_ID=“esp32-temperature-pskid@ttgo-demo” CONFIG_GOLIOTH_SYSTEM_CLIENT_PSK=“a_strong_password” CONFIG_ESP32_WIFI_SSID=“your_wifi_ssid” CONFIG_ESP32_WIFI_PASSWORD=“your_wifi_password” [/sourcecode] Now add the device credentials–Identity (PDK-ID) and Pre-Shared Key (PSK)–and your WiFi access point credentials to the project’s prj.conf file. This file should be located at
 ~/zephyrproject/modules/lib/golioth/samples/lightdb_stream/prj.conf. Add the lines in the format shown above. [sourcecode lang=”bash”] $ west build -b esp32 samples/lightdb_stream -p $ west flash [/sourcecode] Finally, use the commands above to build and flash the sample to your ESP32.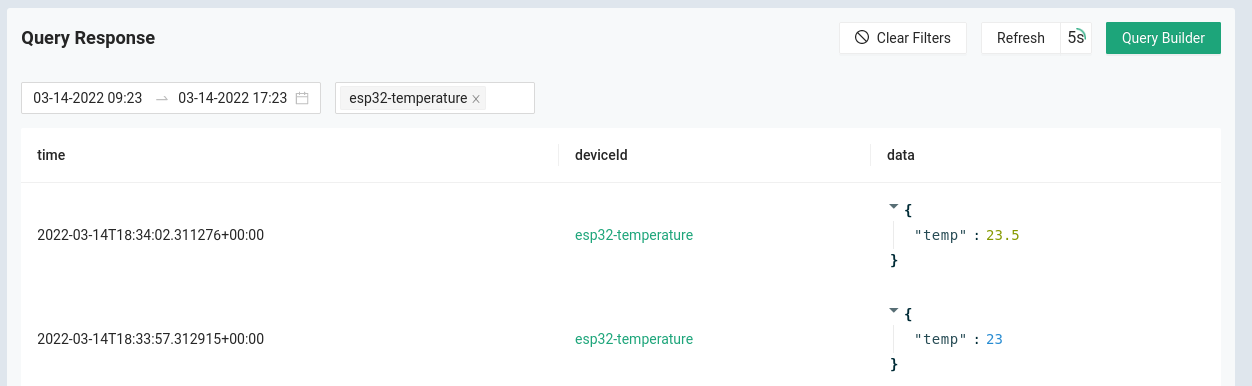 If you go to Monitor→LightDB Stream you will see new temperature data coming in every five seconds. In this window, choose the Last 4h setting from the time selector, your device from the device selector, and enable 5s auto-refresh in the upper right. Each time one of these packets comes in, the data will be automatically updated in Grafana. We just need to set that up, which is next!
2. Configure the Golioth WebSocket API in Grafana Cloud
{#websocket-setup-in-grafana}
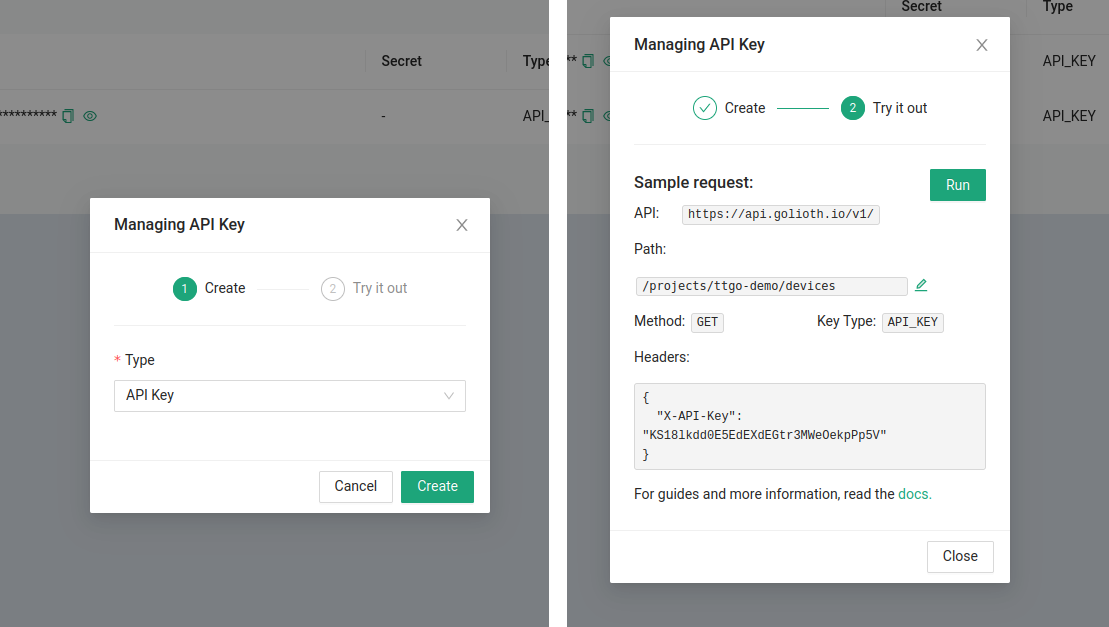 The prerequisite for this step is to get an API key from Golioth.
- Use the API Keys option on the left sidebar of the [Golioth Console][10]
- Click the Create button in the upper right of the main window
- In the resulting dialog (show above), press the Create button The final dialog displays the key and some useful path information. We will use this path along with the
wss://api.golioth.io/v1/ws/ WebSocket endpoint which I looked up in [the Golioth WebSocket docs][4]. [Log into Grafana Cloud][11]. There are a number of services offered, the one we want is simply called Grafana.
- Click the Install via grafana.com button
- On the next screen click the Install plugin button
- Go back to the previous screen and refresh that page. It may take a minute or two, but when the new button appears click Create a WebSocket API data source
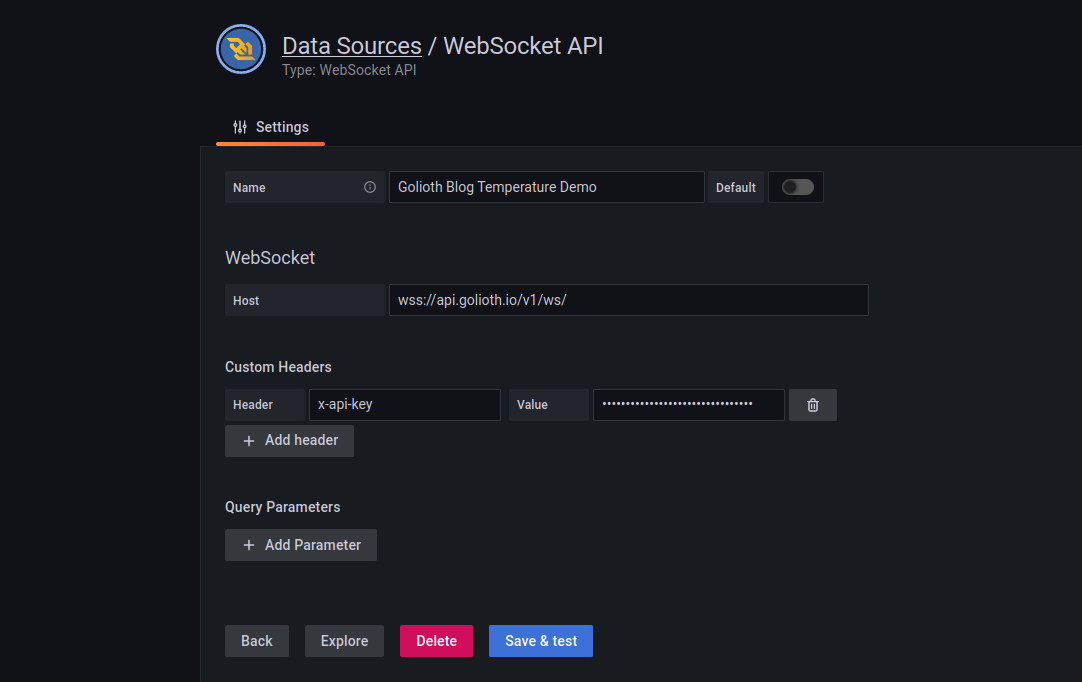 This brings us to setting up our data source.
- Name can be anything you want
- Host is the
wss://api.golioth.io/v1/ws/from the [Golioth Docs][4] - Click the Add header button
- Enter
x-api-keyfor the header value - Paste your API key from the Golioth Console in the Value box
- Enter
- Click the Save & test button We have completed the WebSocket connect between Grafana and Golioth. Now it’s time to visualize the incoming data!
3. Graphing Temperature Data in Grafana
{#grafana-panel-configuration} In the left sidebar of Grafana, click the big plus icon and choose
Dashboard, then click Add Panel.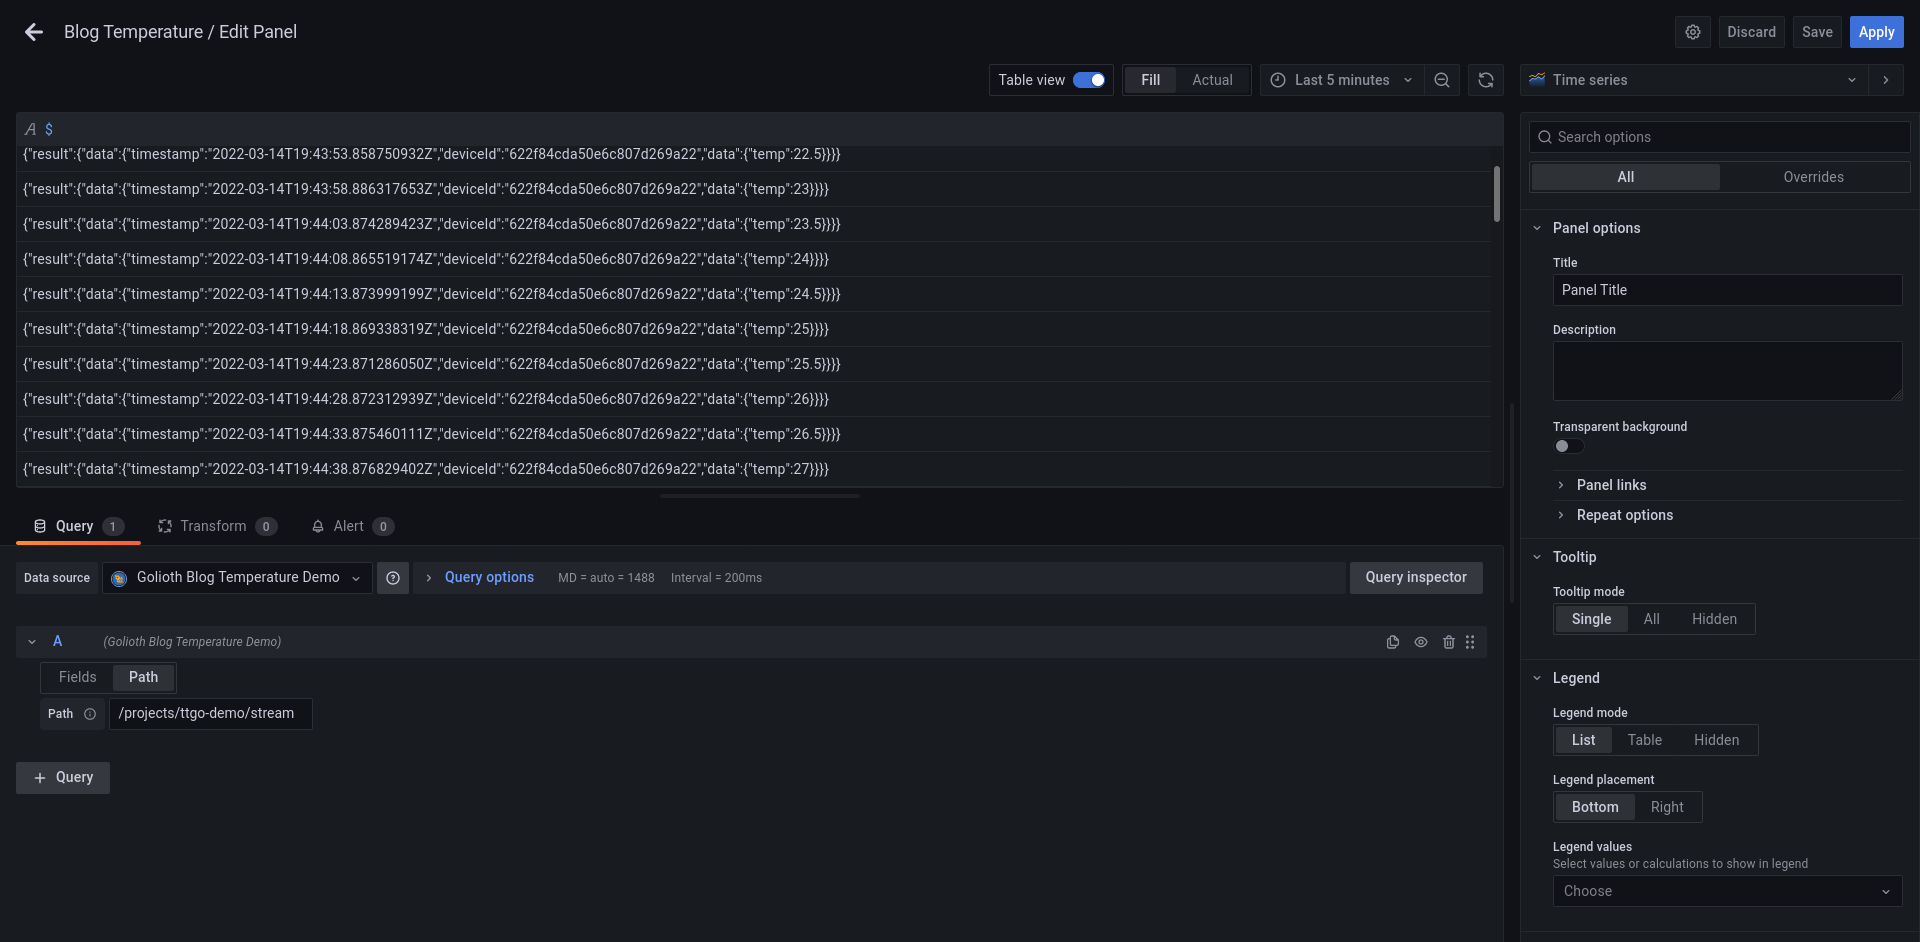
- In the Data source box on the left, select the name of the data source you just set up.
- For now, enter just a
$into the Field box - Click the Path tab
- Follow this format which was shown on the confirmation dialog when you created your API key:
/projects/<name of Golioth project>/stream - Notice I have switched from
/devicesto/stream.
- Follow this format which was shown on the confirmation dialog when you created your API key:
- At the top of the window in the center, turn the Table view on You should begin to see JSON data come in over the table view. Remember that WebSockets visualize realtime data, so JSON will only appear when new packets are sent. Now that we’ve seen the JSON data coming in, we can use it to identify two types of data to use for the graph: temperature and timestamp.
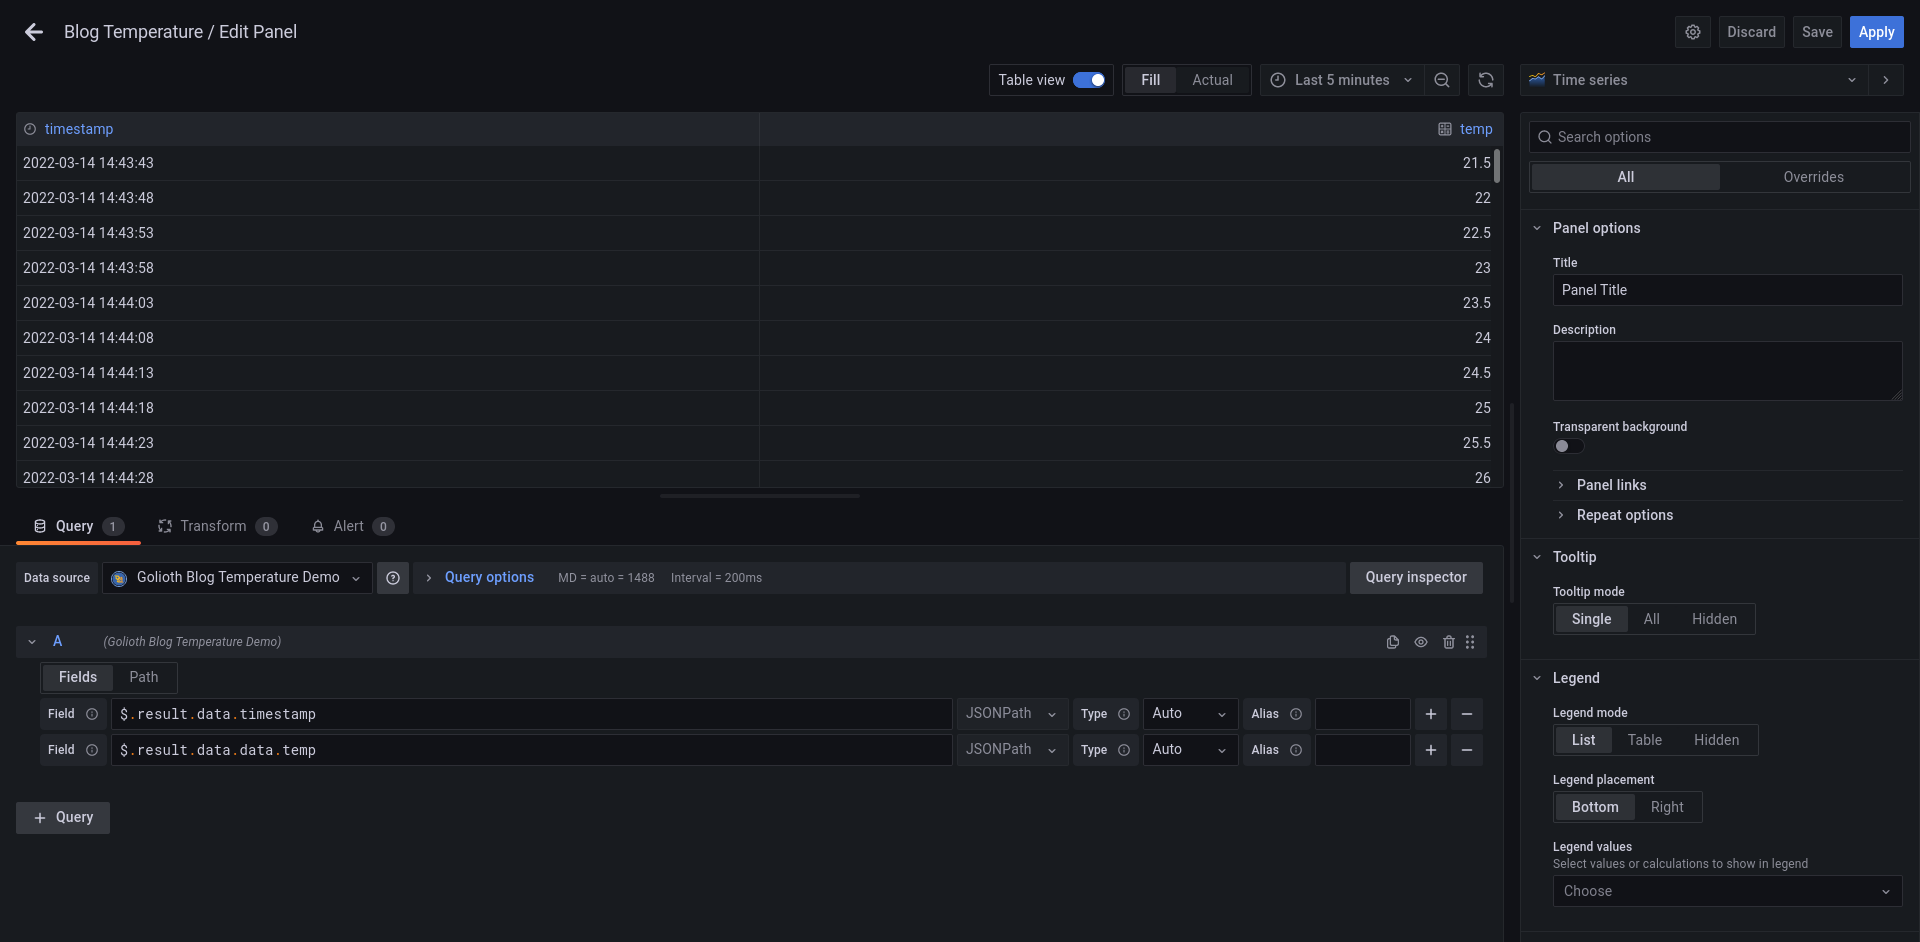 Going back to the Fields tab, we can change the $ character (which means to show all the JSON coming in) to a specific key/value pair.
- Enter
$.result.data.timestamp- You will see the data in the table-view change as you type, this is helpful in navigating the hierarchy
- Click the + button all the way to the right of the Field box to add another field
- Enter
$.result.data.data.temp
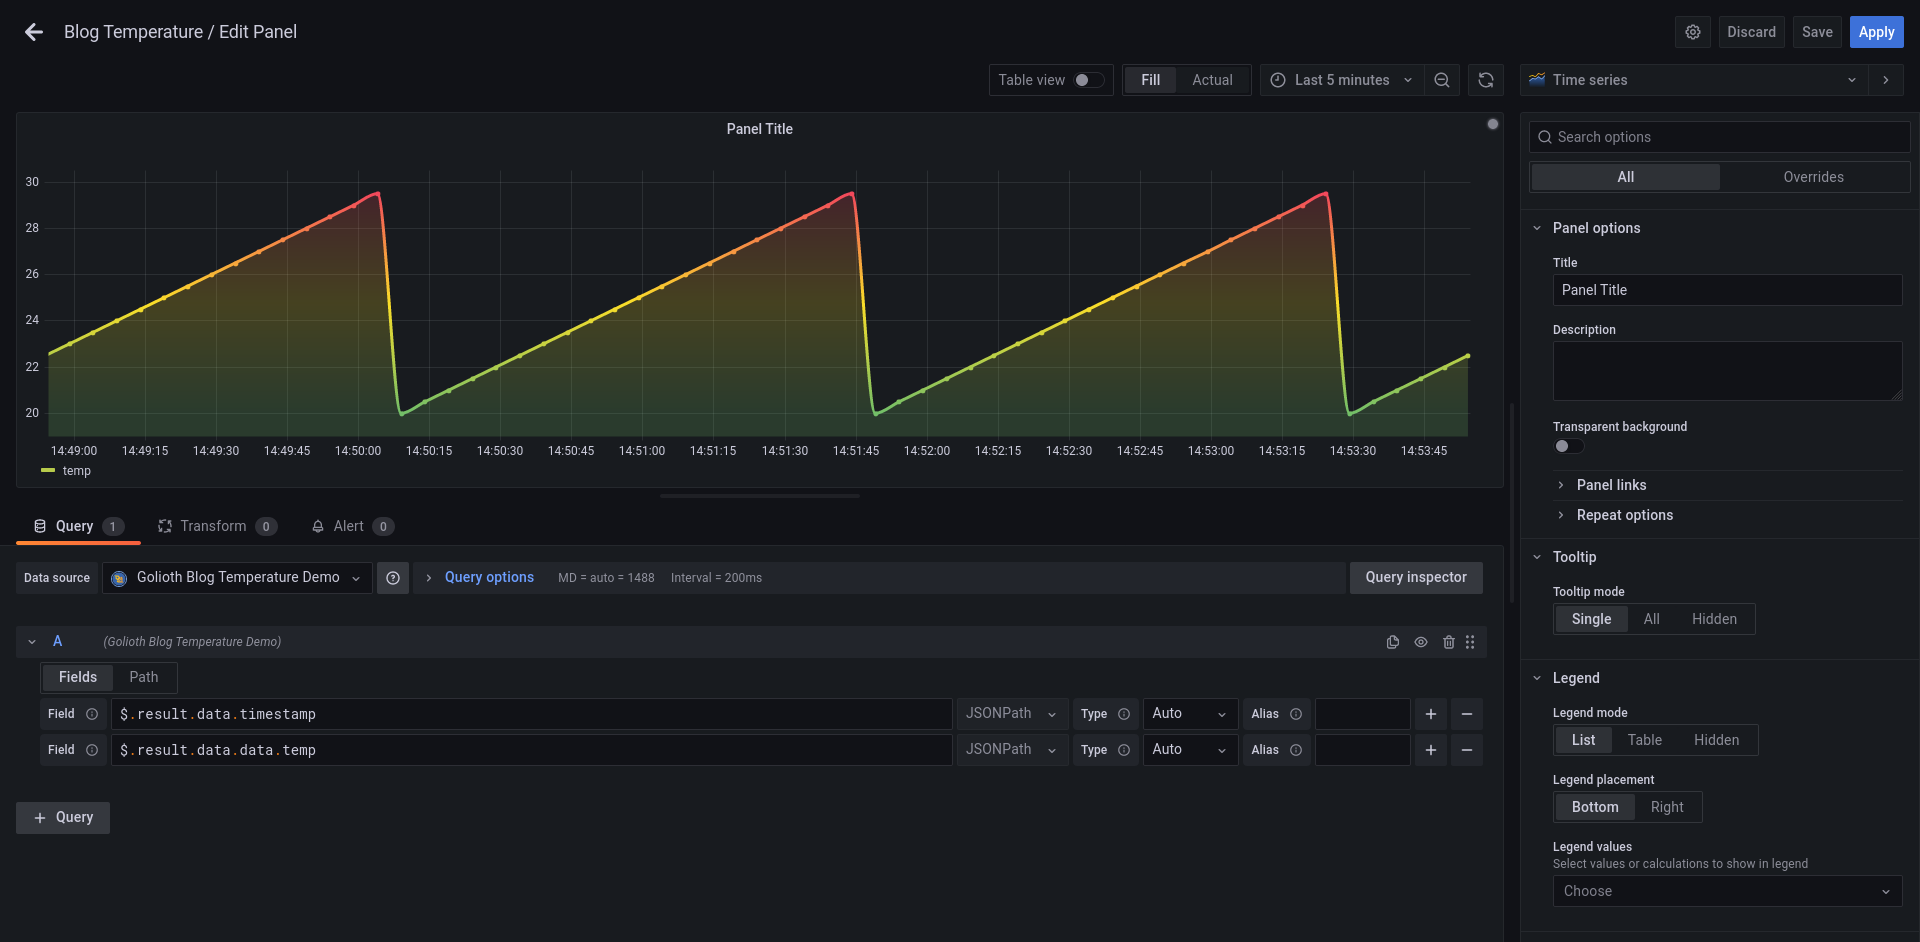 When you click the Table view button at the top, the view will be replaced by a visualization of your data. Here you can see it is obvious that I’m using simulated temperature data. You can also change the way it is visualized by clicking on the Time series menu in the upper right.
Conclusion
This is one simple example that is graphing a single stream from one device. But the principle scales with your IoT fleet. Graphing large numbers of devices across multiple projects takes little more than changing how you use your Path and Field settings on the panel. With Grafana you can easily group together multiple panels into a dashboard, with visualization options tailored to almost any data type. [1]: https://blog.golioth.io/using-websockets-with-grafana-golioth-demo/ [2]: https://grafana.com/products/cloud/ [3]: https://golioth.io/ [4]: https://docs.golioth.io/reference/websocket/overview [5]: https://github.com/golioth/grafana-websocket-plugin [6]: #golioth-sensor-setup [7]: #websocket-setup-in-grafana [8]: #grafana-panel-configuration [9]: https://github.com/golioth/golioth-zephyr-sdk/tree/main/samples/lightdb_stream [10]: https://console.golioth.io [11]: https://grafana.com/